web developer and learner. Love to talk about society, education and religion.(I don't pray though) Wish to travel a bit more. started reading again after 8 yrs
Recently, I did myself a favor and bought a little Beelink SER5 Pro Mini PC a home server to run some services I use on my home network and also to run some development containers.
With this shiny new home server, I also wanted to set up some offsite backups for it. I asked on Mastodon for suggestions and got tips to use borgbackup and restic. Both are reasonable suggestions with great documentation.
I run Debian Bookworm on my home server, so the installation of restic was pretty easy with apt install restic. To install resticprofile, I used the guide for linux and ran the following commands:
Depending on the location chosen, the endpoint is one of
fsn1.your-objectstorage.com (Falkenstein)
nbg1.your-objectstorage.com (Nuremberg)
hel1.your-objectstorage.com (Helsinki)
My server has just a small 500 GB SSD disk so far, so I decided to go with a single backup configuration that backups the whole device with some exceptions. The backup is scheduled at midnight and the cleanup process at half past midnight.
The configuration file is pretty straightforward and easy. I placed it in the one of the default locations /usr/local/etc/resticprofile/profiles.yaml.
# yaml-language-server: $schema=https://creativeprojects.github.io/resticprofile/jsonschema/config-1.json
version: '1'
default:
repository: 's3:https://<Endpoint of the bucket>/<Name of the S3 Bucket>'
initialize: true
env:
AWS_ACCESS_KEY_ID: <Your Access Key>
AWS_SECRET_ACCESS_KEY: <Your Secret Key>
RESTIC_PASSWORD: <Some long and cryptic string>
backup:
source:
- /
exclude:
- /dev
- /media
- /mnt
- /proc
- /run
- /sys
- /tmp
- /var/cache
- /var/lib/docker
- .cache
schedule-permission: system
schedule-log: "/var/log/resticprofile/homeserver-backup.log"
# Every day at midnight
schedule: "*-*-* 00:00:00"
forget:
# Keep the last 10 snapshots
keep-last: 10
prune: true
schedule-permission: system
schedule-log: "/var/log/resticprofile/homeserver-forget.log"
# Every day at half past midnight
schedule: "*-*-* 00:30:00"
Initialize and do your first backup
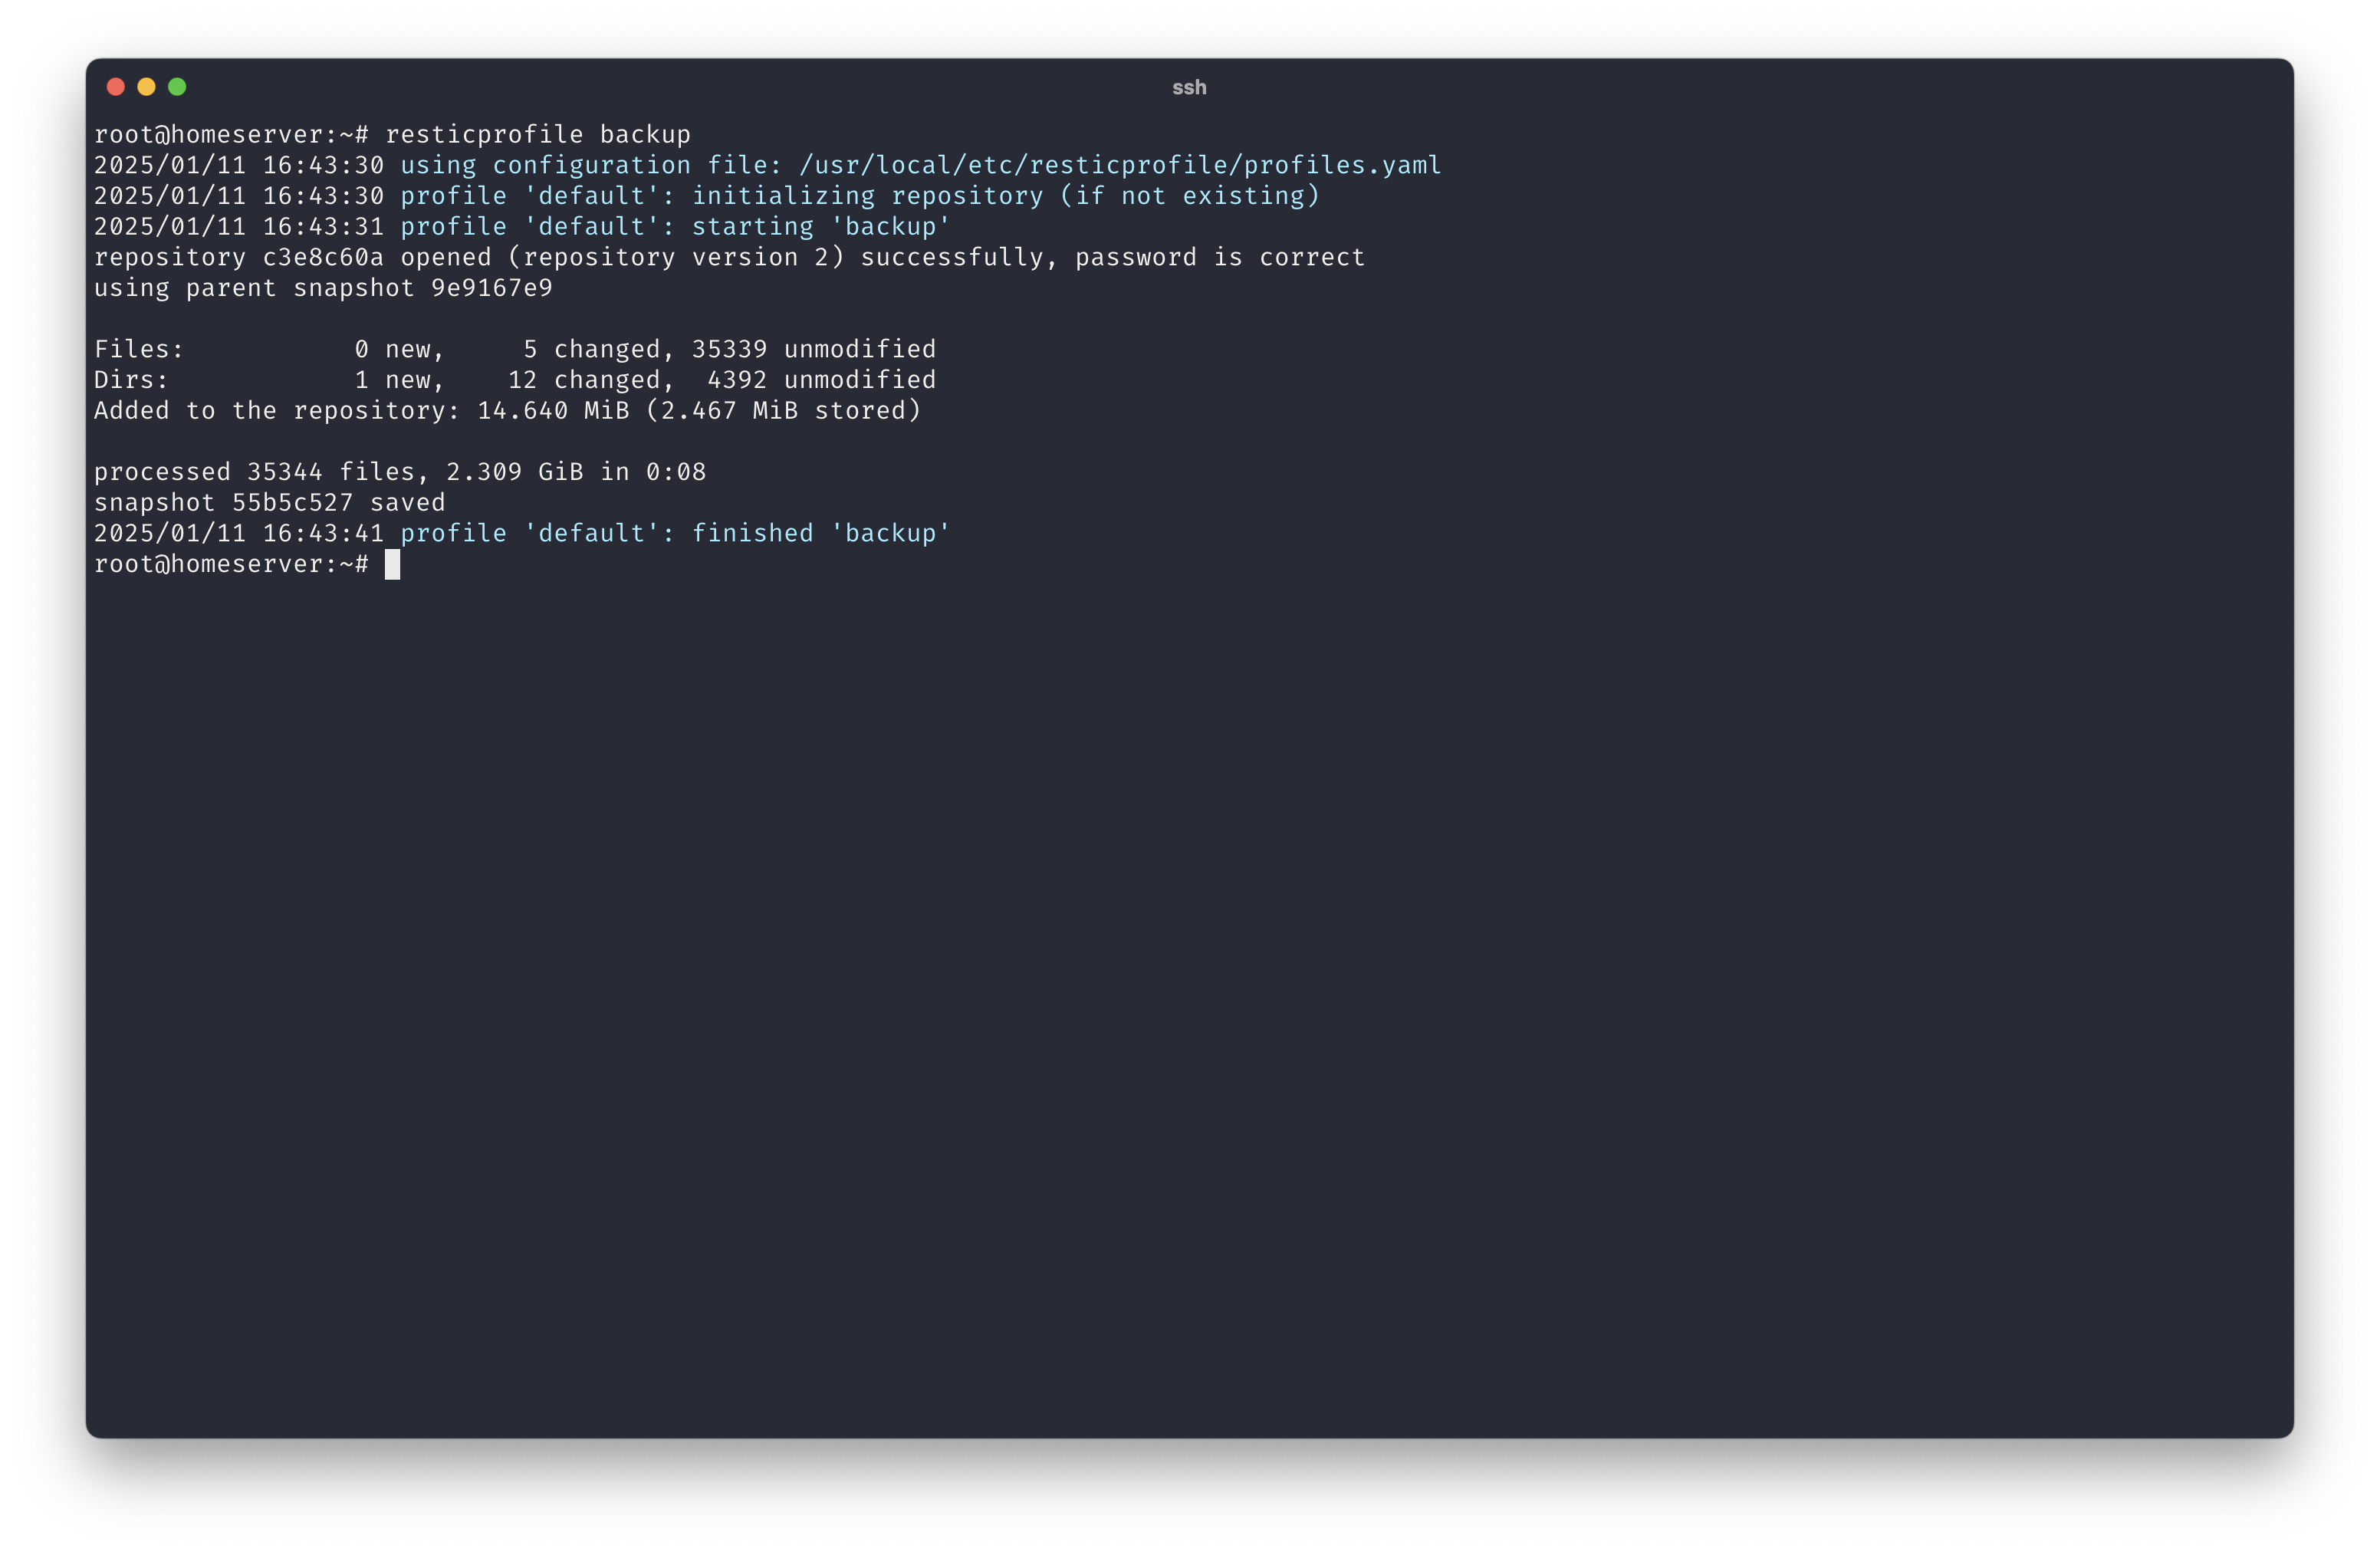
To do the initialization of the repository and run my first backup, I had to call the following two commands.
resticprofile init
resticprofile backup
Scheduling backups
Finally, a lazy guy like me wants a regular process for his backup. resticprofile has a handy command to install a scheduler for me that obeys the rules configured in the profiles.yaml above.
When I fully switched to uv last week, I had the issue to solve, that I had to change my default Dockerfile too. First, I read Hynek’s article on production-ready Docker containers with uv. Then I stumbled across Michael’s article on Docker containers using uv. Both articles are great and gave me a lot of insight what I had to change after switching from Poetry to uv.
My plan and requirements:
Embrace uv sync for installing
Install Python using uv
A multi-stage built
Support my Django projects
Ok, “ideal” might be a big too bold as a statement, but I currently enjoy this 4-stage Dockerfile to building my production containers for various services — small and big. At the very end, you can find the complete files from my django-startproject template.
Stage 1: The Debian base system
# Stage 1: General debian environmentFROM debian:stable-slim AS linux-base# Assure UTF-8 encoding is used.ENV LC_CTYPE=C.utf8# Location of the virtual environmentENV UV_PROJECT_ENVIRONMENT="/venv"# Location of the python installation via uvENV UV_PYTHON_INSTALL_DIR="/python"# Byte compile the python files on installationENV UV_COMPILE_BYTECODE=1# Python verision to useENV UV_PYTHON=python3.12# Tweaking the PATH variable for easier useENV PATH="$UV_PROJECT_ENVIRONMENT/bin:$PATH"# Update debianRUN apt-get updateRUN apt-get upgrade -y# Install general required dependenciesRUN apt-get install --no-install-recommends -y tzdata
Dockerfile
Stage 1 builds the basis for all the other stages and consists basically of a stable Debian image with some environment variables to tweak uv, necessary updates and tzdata. This stage more or less never changes and stays in the cache.
It is far too easy and fast to set up a working Python environment than I could skip this step. And why should I do something else than I do on my development machine?
uv sync does it all in a single step — install Python, set up a virtual environment and install all the dependencies from my Django project.
This step also installs some Debian packages that I need during the build process, but not in the production container.
This stage also changes not that often — only when I add new dependencies to the project.
This stage might be optional for many people, but for me, it is an essential step in the build process.
I enjoy using Tailwind CSS and want to build the production CSS file as late as possible. I don’t like it, if it gets checked in because it is automatically rebuilt during development anyway.
My apps normally have to support German, English, and French. So translation files have to be compiled too. Again, I don’t like it, when these files are part of the git repository.
If you don’t use Tailwind and aren’t concerned about i18n, just remove the corresponding lines.
The final stage is again based on the base Debian layer from stage 1 and just copies the relevant files from the building environment – Python, the virtual environment and my application code.
To use the –exclude flag, I have to define the syntax of the Dockerfile at the start of it.
# syntax=docker.io/docker/dockerfile:1.7-labs
Dockerfile
Summary
For me, the above steps fulfill all my requirements, the caching works nicely, and the build time is fast. Usually, only stage 3 and stage 4 have to be built. The result is, that a new container is built in 1–2 seconds.
Complete Dockerfile and entrypoint.sh script
# syntax=docker.io/docker/dockerfile:1.7-labs# Stage 1: General debian environmentFROM debian:stable-slim AS linux-base# Assure UTF-8 encoding is used.ENV LC_CTYPE=C.utf8# Location of the virtual environmentENV UV_PROJECT_ENVIRONMENT="/venv"# Location of the python installation via uvENV UV_PYTHON_INSTALL_DIR="/python"# Byte compile the python files on installationENV UV_COMPILE_BYTECODE=1# Python verision to useENV UV_PYTHON=python3.12# Tweaking the PATH variable for easier useENV PATH="$UV_PROJECT_ENVIRONMENT/bin:$PATH"# Update debianRUN apt-get updateRUN apt-get upgrade -y# Install general required dependenciesRUN apt-get install --no-install-recommends -y tzdata# Stage 2: Python environmentFROM linux-base AS python-base# Install debian dependenciesRUN apt-get install --no-install-recommends -y build-essential gettext# Install uvCOPY --from=ghcr.io/astral-sh/uv:latest /uv /usr/local/bin/uv# Create virtual environment and install dependenciesCOPY pyproject.toml ./COPY uv.lock ./RUN uv sync --frozen --no-dev --no-install-project# Stage 3: Building environmentFROM python-base AS builder-baseWORKDIR /appCOPY . /app# Build static filesRUN python manage.py tailwind buildRUN python manage.py collectstatic --no-input# Compile translation filesRUN python manage.py compilemessages# Stage 4: Webapp environmentFROM linux-base AS webapp# Copy python, virtual env and static assetsCOPY --from=builder-base $UV_PYTHON_INSTALL_DIR $UV_PYTHON_INSTALL_DIRCOPY --from=builder-base $UV_PROJECT_ENVIRONMENT $UV_PROJECT_ENVIRONMENTCOPY --from=builder-base --exclude=uv.lock --exclude=pyproject.toml /app /app# Start the application serverWORKDIR /appEXPOSE 8000CMD ["docker/entrypoint.sh"]
Dockerfile
My choice of entry point script might raise some discussion. I know that many people don’t enjoy running migrations on startup of the container. For me, this has worked for years. And which WSGI server you use is up to you. I currently enjoy granian. Before that, I have used gunicorn and uwsgi. Use whatever fits your requirements.
Metrics measure performance, consumption, productivity, and many other software properties over time. They allow engineers to monitor the evolution of a series of measurements (like CPU or memory usage, requests duration, latencies, and so on) via alerts and dashboards. Metrics have a long history in the world of IT monitoring and are widely used by engineers together with logs and traces to detect when systems don’t perform as expected.
In its most basic form, a metric data point is made of:
A metric name
The timestamp when the data point was collected
A measurement represented by a numeric value
In the last ten years, as systems have become more and more complex, the concept of dimensional metrics, that is, metrics that also include a set of tags or labels (i.e., the dimensions) to provide additional context, emerged. Monitoring systems that support dimensional metrics allow engineers to easily aggregate and analyze a metric across multiple components and dimensions by querying for a specific metric name and filtering and grouping by label.
For modern dynamic systems made up of many components, Prometheus, a Cloud Native Computing Foundation (CNCF) project, has become the most popular open-source monitoring software and effectively the industry standard for metrics monitoring. Prometheus defines a metric exposition format and a remote write protocol that the community and many vendors have adopted to expose and collect metrics becoming a de facto standard. OpenMetrics is another CNCF project that builds upon the Prometheus exposition format to offer a vendor-agnostic, standardized model for the collection of metrics that aims to be part of the Internet Engineering Task Force (IEFT).
More recently, another CNCF project, OpenTelemetry, has emerged with the goal of providing a new standard that unifies the collection of metrics, traces, and logs, enabling easier instrumentation and correlation across telemetry signals.
With a few different options to pick from, you may be wondering which standard is best for you. To help you answer this question, we have prepared a three-part blog post series in which we will be diving deep into the metric standards hosted by the CNCF. In this first post, we will cover Prometheus metrics; in the next one, we will review OpenTelemetry metrics; and in the final blog post, we will directly compare both formats—providing some recommendations for better interoperability.
Our hope is that after reading these blog posts, you will understand the differences between each standard, so you can decide which one would best address your current (and future) needs.
Prometheus Metrics
First things first. There are four types of metrics collected by Prometheus as part of its exposition format:
The pull model works great when monitoring a Kubernetes cluster, thanks to service discovery and shared network access within the cluster, but it’s harder to use to monitor a dynamic fleet of virtual machines, AWS Fargate containers or Lambda functions with Prometheus. Why? It’s difficult to identify the metrics endpoints to be scraped, and access to those endpoints may be limited by network security policies. To solve some of those problems, the community released the Prometheus Agent Mode at the end of 2021, which only collects metrics and sends them to a monitoring backend using the remote write protocol.
Prometheus can scrape metrics in both the Prometheus exposition and the OpenMetrics formats. In both cases, metrics are exposed via HTTP using a simple text-based format (more commonly used and widely supported) or a more efficient and robust protocol buffer format. One big advantage of the text format is that it is human-readable, which means you can open it in your browser or use a tool like curl to retrieve the current set of exposed metrics.
Prometheus uses a very simple metric model with four metric types that are only supported in the client libraries. All the metric types are represented in the exposition format using one or a combination of a single underlying data type. This data type includes a metric name, a set of labels, and a float value. The timestamp is added by the monitoring backend (Prometheus, for example) or an agent when they scrape the metrics.
Each unique combination of a metric name and set of labels defines a series while each timestamp and float value defines a sample (i.e., a data point) within a series.
Some conventions are used to represent the different metric types.
A very useful feature of the Prometheus exposition format is the ability to associate metadata to metrics to define their type and provide a description. For example, Prometheus makes that information available and Grafana uses it to display additional context to the user that helps them select the right metric and apply the right PromQL functions:
Example of a metric exposed using the Prometheus exposition format:
# HELP http_requests_total Total number of http api requests
# TYPE http_requests_total counter
http_requests_total{api="add_product"} 4633433
# HELP is used to provide a description for the metric and # TYPE a type for the metric
Now, let's get into more detail about each of the Prometheus metrics in the exposition format.
Counters
Counter metrics are used for measurements that only increase. Therefore they are always cumulative—their value can only go up. The only exception is when the counter is restarted, in which case its value is reset to zero.
The actual value of a counter is not typically very useful on its own. A counter value is often used to compute the delta between two timestamps or the rate of change over time.
For example, a typical use case for counters is measuring API calls, which is a measurement that will always increase:
http_requests_total{api="add_product"} 4633433
The metric name is http_requests_total, it has one label named api with a value of add_product and the counter’s value is 4633433. This means that the add_product API has been called 4,633,433 times since the last service start or counter reset. By convention, counter metrics are usually suffixed with _total.
The absolute number does not give us much information, but when used with PromQL’s rate function (or a similar function in another monitoring backend), it helps us understand the requests per second that API is receiving. The PromQL query below calculates the average requests per second over the last five minutes:
rate(http_requests_total{api="add_product"}[5m])
To calculate the absolute change over a time period, we would use a delta function which in PromQL is called increase():
This would return the total number of requests made in the last five minutes, and it would be the same as multiplying the per second rate by the number of seconds in the interval (five minutes in our case):
Other examples where you would want to use a counter metric would be to measure the number of orders in an e-commerce site, the number of bytes sent and received over a network interface or the number of errors in an application. If it is a metric that will always go up, use a counter.
Below is an example of how to create and increase a counter metric using the Prometheus client library for Python:
from prometheus_client import Counter
api_requests_counter = Counter(
'http_requests_total',
'Total number of http api requests',
['api']
)
api_requests_counter.labels(api='add_product').inc()
Note that since counters can be reset to zero, you want to make sure that the backend you use to store and query your metrics will support that scenario and still provide accurate results in case of a counter restart. Prometheus and PromQL-compliant Prometheus remote storage systems like Promscale handle counter restarts correctly.
Gauges
Gauge metrics are used for measurements that can arbitrarily increase or decrease. This is the metric type you are likely more familiar with since the actual value with no additional processing is meaningful and they are often used. For example, metrics to measure temperature, CPU, and memory usage, or the size of a queue are gauges.
For example, to measure the memory usage in a host, we could use a gauge metric like:
The metric above indicates that the memory used in node host1.domain.com at the time of the measurement is around 900 megabytes. The value of the metric is meaningful without any additional calculation because it tells us how much memory is being consumed on that node.
Unlike when using counters, rate and delta functions don’t make sense with gauges. However, functions that compute the average, maximum, minimum, or percentiles for a specific series are often used with gauges. In Prometheus, the names of those functions are avg_over_time, max_over_time, min_over_time, and quantile_over_time. To compute the average of memory used on host1.domain.com in the last ten minutes, you could do this:
To create a gauge metric using the Prometheus client library for Python you would do something like this:
from prometheus_client import Gauge
memory_used = Gauge(
'node_memory_used_bytes',
'Total memory used in the node in bytes',
['hostname']
)
memory_used.labels(hostname='host1.domain.com').set(943348382)
Histograms
Histogram metrics are useful to represent a distribution of measurements. They are often used to measure request duration or response size.
Histograms divide the entire range of measurements into a set of intervals—named buckets—and count how many measurements fall into each bucket.
A histogram metric includes a few items:
A counter with the total number of measurements. The metric name uses the _count suffix.
A counter with the sum of the values of all measurements. The metric name uses the _sum suffix.
The histogram buckets are exposed as counters using the metric name with a _bucket suffix and a le label indicating the bucket upper inclusive bound. Buckets in Prometheus are inclusive, that is a bucket with an upper bound of N (i.e., le label) includes all data points with a value less than or equal to N.
For example, the summary metric to measure the response time of the instance of the add_product API endpoint running on host1.domain.com could be represented as:
The example above includes the sum, the count, and 12 buckets. The sum and count can be used to compute the average of a measurement over time. In PromQL, the average duration for the last five minutes will be computed as follows:
It can also be used to compute averages across series. The following PromQL query would compute the average request duration in the last five minutes across all APIs and instances:
With histograms, you can compute percentiles at query time for individual series as well as across series. In PromQL, we would use the histogram_quantile function. Prometheus uses quantiles instead of percentiles. They are essentially the same thing but quantiles are represented on a scale of 0 to 1 while percentiles are represented on a scale of 0 to 100. To compute the 99th percentile (0.99 quantile) of response time for the add_product API running on host1.domain.com, you would use the following query:
One big advantage of histograms is that they can be aggregated. The following query returns the 99th percentile of response time across all APIs and instances:
histogram_quantile(0.99, sum by (le) (rate(http_request_duration_seconds_bucket[5m])))
In cloud-native environments, where there are typically many instances of the same component running, the ability to aggregate data across instances is key.
Histograms have three main drawbacks:
First, buckets must be predefined, requiring some upfront design. If your buckets are not well defined, you may not be able to compute the percentiles you need or would consume unnecessary resources. For example, if you have an API that always takes more than one second, having buckets with an upper bound ( le label) smaller than one second would be useless and just consume compute and storage resources on your monitoring backend. On the other hand, if 99.9 % of your API requests take less than 50 milliseconds, having an initial bucket with an upper bound of 100 milliseconds will not allow you to accurately measure the performance of the API.
Second, they provide approximate percentiles, not accurate percentiles. This is usually fine as long as your buckets are designed to provide results with reasonable accuracy.
And third, since percentiles need to be calculated server-side, they can be very expensive to compute when there is a lot of data to be processed. One way to mitigate this in Prometheus is to use recording rules to precompute the required percentiles.
The following example shows how you can create a histogram metric with custom buckets using the Prometheus client library for Python:
Like histograms, summary metrics are useful to measure request duration and response sizes.
A summary metric includes these items:
A counter with the total number of measurements. The metric name uses the _count suffix.
A counter with the sum of the values of all measurements. The metric name uses the _sum suffix. Optionally, a number of quantiles of measurements exposed as a gauge using the metric name with a quantile label. Since you don’t want those quantiles to be measured from the entire time an application has been running, Prometheus client libraries use streamed quantiles that are computed over a sliding time window (which is usually configurable).
For example, the summary metric to measure the response time of the instance of the add_product API endpoint running on host1.domain.com could be represented as:
This example above includes the sum and count as well as five quantiles. Quantile 0 is equivalent to the minimum value and quantile 1 is equivalent to the maximum value. Quantile 0.5 is the median and quantiles 0.90, 0.95, and 0.99 correspond to the 90th, 95th, and 99th percentile of the response time for the add_product API endpoint running on host1.domain.com.
Like histograms, summaries include sum and count that can be used to compute the average of a measurement over time and across time series.
Summaries provide more accurate quantiles than histograms but those quantiles have three main drawbacks:
First, computing the quantiles is expensive on the client-side. This is because the client library must keep a sorted list of data points overtime to make this calculation. The implementation in the Prometheus client libraries uses techniques that limit the number of data points that must be kept and sorted, which reduces accuracy in exchange for an increase in efficiency. Note that not all Prometheus client libraries support quantiles in summary metrics. For example, the Python library does not have support for it.
Second, the quantiles you want to query must be predefined by the client. Only the quantiles for which there is a metric already provided can be returned by queries. There is no way to calculate other quantiles at query time. Adding a new quantile requires modifying the code and the metric will be available from that time forward.
And third and most important, it’s impossible to aggregate summaries across multiple series, making them useless for most use cases in dynamic modern systems where you are interested in the view across all instances of a given component. Therefore, imagine that in our example the add_product API endpoint was running on ten hosts sitting behind a load balancer. There is no aggregation function that we could use to compute the 99th percentile of the response time of the add_product API endpoint across all requests regardless of which host they hit. We could only see the 99th percentile for each individual host. Same thing if instead of the 99th percentile of the response time for the add_product API endpoint we wanted to get the 99th percentile of the response time across all API requests regardless of which endpoint they hit.
The code below creates a summary metric using the Prometheus client library for Python:
from prometheus_client import Summary
api_request_duration = Summary(
'http_request_duration_seconds',
'Api requests response time in seconds',
['api', 'instance']
)
api_request_duration.labels(api='add_product', instance='host1.domain.com').observe(0.3672)
The code above does not define any quantile and would only produce sum and count metrics. The Prometheus client library for Python does not have support for quantiles in summary metrics.
Histograms or Summaries, What Should I Use?
In most cases, histograms are preferred since they are more flexible and allow for aggregated percentiles.
Summaries are useful in cases where percentiles are not needed and averages are enough, or when very accurate percentiles are required. For example, in the case of contractual obligations for the performance of a critical system.
The table below summarizes the pros and cons of histograms and summaries.
Conclusion
In the first part of this blog post series on metrics, we’ve reviewed the four types of Prometheus metrics: counters, gauges, histograms, and summaries. In the next part of the series, we will dissect OpenTelemetry metrics.
Looking for a long-term store for your Prometheus metrics? Check out Promscale, the observability backend built on PostgreSQL and TimescaleDB. It seamlessly integrates with Prometheus, with 100% PromQL compliance, multitenancy, and OpenMetrics exemplars support.
Promscale is an open-source project, and you can use it completely for free. For install instructions in Kubernetes, Docker, or virtual machine, check out our docs.
If you have questions, join the #promscale channel in the Timescale Community Slack. You will be able to directly interact with the team building Promscale and with other developers interested in observability. We’re +4,100 and counting in that channel!
GrabAds is a service that provides businesses with an opportunity to market their products to Grab’s consumer base. During the pandemic, as the demand for food delivery grew, we realised that ads could be a service we offer to our small restaurant merchant-partners to expand their reach. This would allow them to not only mitigate the loss of in-person traffic but also grow by attracting more customers.
Many of these small merchant-partners had no experience with digital advertising and we provided an easy-to-use, scalable option that could match their business size. On the other side of the equation, our large network of merchant-partners provided consumers with more choices. For hungry consumers stuck at home, personalised ads and promotions helped them satisfy their cravings, thus fulfilling their intent of opening the Grab app in the first place!
Why build our own ad server?
Building an ad server is an ambitious undertaking and one might rightfully ask why we should invest the time and effort to build a technically complex distributed system when there are several reasonable off-the-shelf solutions available.
The answer is we didn’t, at least not at first. We used one of these off-the-shelf solutions to move fast and build a minimally viable product (MVP). The result of this experiment was a resounding success; we were providing clear value to our merchant-partners, our consumers and Grab’s overall business.
However, to take things to the next level meant scaling the ads business up exponentially. Apart from being one of the few companies with the user engagement to support an ads business at scale, we also have an ecosystem that combines our network of merchant-partners, an understanding of our consumers’ interactions across multiple services in the Grab superapp, and a payments solution, GrabPay, to close the loop. Furthermore, given the hyperlocal nature of our business, the in-app user experience is highly customised by location. In order to integrate seamlessly with this ecosystem, scale as Grab’s overall business grows and handle personalisation using machine learning (ML), we needed an in-house solution.
What we built
We designed and built a set of microservices, streams and pipelines which orchestrated the core ad serving functionality, as shown below.
Targeting - This is the first step in the ad serving flow. We fetch a set of candidate ads specifically targeted to the request based on keywords the user searched for, the user’s location, the time of day, and the data we have about the user’s preferences or other characteristics. We chose ElasticSearch as the data store for our ads repository as it allows us to query based on a disparate set of targeting criteria.
Capping - In this step, we filter out candidate ads which have exceeded various caps. This includes cases where an advertising campaign has already reached its budget goal, as well as custom requirements about the frequency an ad is allowed to be shown to the same user. In order to make this decision, we need to know how much budget has already been spent and how many times an ad has already been shown. We chose ScyllaDB to store these “stats”, which is scalable, low-cost and can handle the large read and write requirements of this process (more on how this data gets written to ScyllaDB in the Tracking step).
Pacing - In this step, we alter the probability that a matching ad candidate can be served, based on a specific campaign goal. For example, in some cases, it is desirable for an ad to be shown evenly throughout the day instead of exhausting the entire ad budget as soon as possible. Similar to Capping, we require access to information on how many times an ad has already been served and use the same ScyllaDB stats store for this.
Scoring - In this step, we score each ad. There are a number of factors that can be used to calculate this score including predicted clickthrough rate (pCTR), predicted conversion rate (pCVR) and other heuristics that represent how relevant an ad is for a given user.
Ranking - This is where we compare the scored candidate ads with each other and make the final decision on which candidate ads should be served. This can be done in several ways such as running a lottery or performing an auction. Having our own ad server allows us to customise the ranking algorithm in countless ways, including incorporating ML predictions for user behaviour. The team has a ton of exciting ideas on how to optimise this step and now that we have our own stack, we’re ready to execute on those ideas.
Pricing - After choosing the winning ads, the final step before actually returning those ads in the API response is to determine what price we will charge the advertiser. In an auction, this is called the clearing price and can be thought of as the minimum bid price required to outbid all the other candidate ads. Depending on how the ad campaign is set up, the advertiser will pay this price if the ad is seen (i.e. an impression occurs), if the ad is clicked, or if the ad results in a purchase.
Tracking - Here, we close the feedback loop and track what users do when they are shown an ad. This can include viewing an ad and ignoring it, watching a video ad, clicking on an ad, and more. The best outcome is for the ad to trigger a purchase on the Grab app. For example, placing a GrabFood order with a merchant-partner; providing that merchant-partner with a new consumer. We track these events using a series of API calls, Kafka streams and data pipelines. The data ultimately ends up in our ScyllaDB stats store and can then be used by the Capping and Pacing steps above.
Principles
In addition to all the usual distributed systems best practices, there are a few key principles that we focused on when building our system.
Latency - Latency is important for ads. If the user scrolls faster than an ad can load, the ad won’t be seen. The longer an ad remains on the screen, the more likely the user will notice it, have their interest piqued and click on it. As such, we set strict limits on the latency of the ad serving flow. We spent a large amount of effort tuning ElasticSearch so that it could return targeted ads in the shortest amount of time possible. We parallelised parts of the serving flow wherever possible and we made sure to A/B test all changes both for business impact and to ensure they did not increase our API latency.
Graceful fallbacks - We need user-specific information to make personalised decisions about which ads to show to a given user. This data could come in the form of segmentation of our users, attributes of a single user or scores derived from ML models. All of these require the ad server to make dependency calls that could add latency to the serving flow. We followed the principle of setting strict timeouts and having graceful fallbacks when we can’t fetch the data needed to return the most optimal result. This could be due to network failures or dependencies operating slower than usual. It’s often better to return a non-personalised result than no result at all.
Global optimisation - Predicting supply (the amount of users viewing the app) and demand (the amount of advertisers wanting to show ads to those users) is difficult. As a superapp, we support multiple types of ads on various screens. For example, we have image ads, video ads, search ads, and rewarded ads. These ads could be shown on the home screen, when booking a ride, or when searching for food delivery. We intentionally decided to have a single ad server supporting all of these scenarios. This allows us to optimise across all users and app locations. This also ensures that engineering improvements we make in one place translate everywhere where ads or promoted content are shown.
What’s next?
Grab’s ads business is just getting started. As the number of users and use cases grow, ads will become a more important part of the mix. We can help our merchant-partners grow their own businesses while giving our users more options and a better experience.
Some of the big challenges ahead are:
Optimising our real-time ad decisions, including exciting work on using ML for more personalised results. There are many factors that can be considered in ad personalisation such as past purchase history, the user’s location and in-app browsing behaviour. Another area of optimisation is improving our auction strategy to ensure we have the most efficient ad marketplace possible.
Expanding the types of ads we support, including experimenting with new types of content, finding the best way to add value as Grab expands its breadth of services.
Scaling our services so that we can match Grab’s velocity and handle growth while maintaining low latency and high reliability.
Join us
Grab is a leading superapp in Southeast Asia, providing everyday services that matter to consumers. More than just a ride-hailing and food delivery app, Grab offers a wide range of on-demand services in the region, including mobility, food, package and grocery delivery services, mobile payments, and financial services across over 400 cities in eight countries.
Powered by technology and driven by heart, our mission is to drive Southeast Asia forward by creating economic empowerment for everyone. If this mission speaks to you, join our team today!
I know I'm probably the last one to find this out, but this has been an issue for a long time for me. I've been constantly building and storing SQL files in the actual container layers, thinking that was the correct way to do it. Thankfully, I was completely wrong.
Here is the correct way to do it.
Assuming you are in a directory with the SQL files you want.
FROM postgres:12.8
COPY *.sql /docker-entrypoint-initdb.d/
On startup Postgres will load the SQL files into the database. I've wasted a lot of time doing it the other way and somehow missed this the entire time. Hopefully I save you a bunch of time!
For Mongo
FROM mongo:4.2
COPY dump /docker-entrypoint-initdb.d/
COPY restore.sh /docker-entrypoint-initdb.d/
The restore.sh script is below.
#!/bin/bash
cd /docker-entrypoint-initdb.d || exit
ls -ahl
mongorestore /docker-entrypoint-initdb.d/
Just do a mongodump into a directory called dump and then when you want it, load the data with the restore.sh script inside the container.
In my previous post, I explored the distinction between your brand identity (what people can see / touch) and the more ephemeral concept of your brand positioning which covers things like personality, experience, and promise.
With your brand positioning defined, you’re ready to work on your brand identity. Working with a designer, your brand identity will include your logo and visual aesthetics along with all the other visual touch points your target audience might have with your company.
Design Matters
The visual identity will communicate your core brand positioning and be immediately identifiable as your company. Importantly, it should provide a consistent and coherent experience that reinforces your brand identity wherever you interact with your customers.
Many founders invest in an impressive landing page or product dashboard but fail to follow through on all the other ways you have contact with a customer. A common mistake is to ignore onboarding emails, transactional emails (such as alerts or invoices), and documentation even though they are some of the initial or most frequent ways customers interact with your product.
Delivering a consistent visual identity builds familiarity and prevents a disjointed relationship with your tool, making it easier for people to recall and recognize your brand. From a practical perspective, it also offers a higher level of polish that builds trust in your product.
Brand Style Guide
One of the easiest ways to ensure consistency is to create a brand style guide that sets out the look and feel of your brand complete with how your logo should be presented, the typography and color palette you should use, and any rules regarding other visual elements such as the use of photography or illustrations.
This can be a lot of work, especially for a new startup or project. Starting out, I recommend creating a simple document that outlines your brand assets, and the rules for how these assets, colors and fonts are expected to be used. At Console, we currently use a living Figma page that we update as new assets are introduced.
Even with a small team and budget, you’ll be surprised how far your brand will travel and opportunities for inconsistencies will emerge. From social media posts and conference swag to new iterations of your tool, without clear guidelines, you risk undermining your visual identity with rogue fonts and slightly off colors that undo the brand you're building.
Tone and Voice
As a natural extension of your visual identity, all the copy you write should also cohere and be true to your brand. Copy is often overlooked, and while you’re unlikely to have an in-house copywriter at hand to draft and proof all copy, it pays to give some thought to how and what you write best expresses your brand positioning.
As with design, your writing style should be consistent across all communication channels and match the voice of your product. The tone of your writing will vary depending upon the scenario. A landing page is likely to have a more evangelical tone than an email to a disappointed customer, but your brand’s voice should remain consistent.
Mailchimp’s Content Style Guide is an excellent primer for anyone starting to think about how they should approach copy. While their voice and tone are likely to be different from yours, their guidelines serve as a valuable template for any start-up to consider.
Tell your story
When planning your brand positioning you will most likely also set out your company’s mission. With a clear mission statement, your story should reinforce and bring context and clarity to your mission. A story that is misaligned with your company’s mission will feel disingenuous and confusing.
Good storytelling delivers a richness and emotional connection with your brand. It builds trust in your company, makes your products more memorable, and increases the likelihood of word-of-mouth recommendations thanks to the empathy for your mission that it can engender.
To begin you will need to define the narrative you want to tell, outlining clear messaging that will resonate with your target audience and be true to your product and brand.
Your story should be meaningful (what do you stand for? / believe in?), simple (can you communicate it clearly?), honest (is it true to your product?), and emotional (how does your product or brand make people feel?).
Your story can be communicated in many ways, and the best brands take their customers on a journey that is delivered across a range of media.
When thinking about your brand story, consider answering these questions:
Why did you start this company?
What problem does your product solve?
What unifies your audience / what do they care about?
What can you do to support your mission beyond what your product does?
How can I personalize my story?
How do I want people to feel when I tell my story
Strategies to communicate your brand
Building a brand is largely a layering experience achieved through ongoing connections with your target audience. As a start-up, with limited budget and resources, your brand story can become one of your most powerful marketing tools. Here are some of the ways to tell your story:
Founder stories
Founder interviews are a simple and effective way to build resonance with your product through sharing the journey you've taken to launch the product. The best stories bring meaning to the value of your tool and a deeper understanding of why I can trust this product because of the founder's journey.
Marketing Campaigns
DuckDuckGo’s brand story is told through a range of formats that collectively reinforce each other. From the founder’s origin story, to marketing stunts and messaging that always positions them as the little guy taking on the tech giants:
‘DuckDuckGo began as an idea for a better search engine experience. We hatched out of a few servers in a dusty basement.'
DuckDuckGo have aligned themselves with their customers, in their mission for greater digital privacy. In 2011 they invested $7,000 in a billboard ad for four weeks in San Francisco's tech-heavy SOMA district. The ad caught the media's attention immediately and put DuckDuckGo on the map with people who care about digital privacy.
Branded Content
Branded content through blog posts, videos and podcasts are an effective way to demonstrate your expertise in a topic while offering value to your target audience. For start-ups, investing in branded content can be expensive and time-intensive, so careful consideration needs to be given to the role this can play in wider marketing efforts during your early months. Successfully done, branded content can deepen engagement with your customers and reinforce your brand positioning as an engaged leader within your field.
Supporting the Community
Talk the talk and walk the walk! Giving back to the developer community is a great way to demonstrate your affinity with a particular cause or project. Supporting the developer community can involve financial support, but it can also be achieved through partnering with projects that need help from your expertise. Fixing docs, helping spread the word and submitting pull requests for fixes and improvements are all good options for open source software.
Events
Similar to branded content, events (virtual and IRL) are an effective way to deepen your relationship with your customers and reinforce your company's mission.
Gitpod's DevX Conf provided a platform for them to connect with customers, making their team available to answer any questions they have about their product as well as showcasing their latest releases.
Customer Service
Customer service interactions provide a rare opportunity to surprise and delight customers. Strong brands typically extend their brand ethos to customer support treating it as a chance to build a greater connection with their customer, rather than a problem to navigate.
As customer service-type queries are increasingly managed publicly on social media (and GitHub for developer products), ensuring that your communication is on-brand is essential.
Thought Leadership
Investment in thought leadership research demonstrates authority and understanding within your category, also creating useful marketing collateral. Thought leadership branding can be achieved through independent research, white papers, and surveys that reveal insights that align with your company's mission.
Little touches
There are countless little things you can do that can be both memorable and support your brand communication. At Console, our mission is to be a developer-first company. With this in mind, it was imperative for us to demonstrate our credentials through even the smallest interactions, which is why we offer dark and light mode on the website.
Building a brand takes time and is the product of many customer interactions. From the visual identity on your website to the comms in your marketing campaigns, crafting a brand in the imagination of your customer is the product of a consistent and coherent approach to speaking to your audience. Successfully realized it will forge stronger relations with your customers that improve long term retention and that will support all your marketing efforts.